Effective September 1, 2018, Wizetrade will officially be shut down and be completely out of business. Wizetrade has offered trend analysis software for many years, the software was being used by traders for trend analysis for the stock, options and currency market. Wizetrade advertised the system as simple red and green lights for buying and selling. They also offer live market alerts.
The Wizetrade trend analysis system was available to traders for $150 per month. Now that Wizetrade is shutting down their former clients are looking for alternatives to the Wizetrade software and tools.
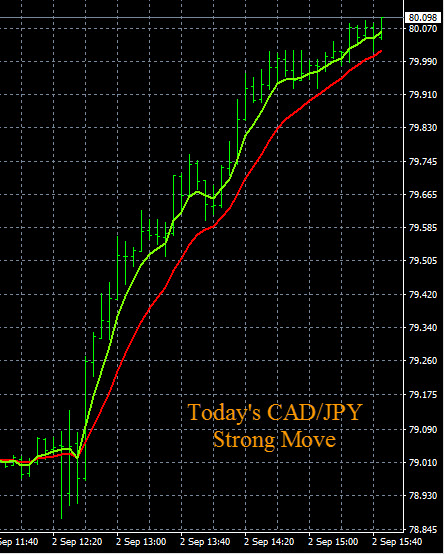
For currency traders we recommend the Forexearlywarning trading system. The monthly fee of $19.95 for the Forexearlywarning trading system is much cheaper than the Wizetrade system. The documentation for the Forexearlywarning trading system is free on the Forexearlywarning website in the form of 35 written and illustrated forex lessons. To replace the Wizetrade trend analysis software, Forexearlywarning has a set of free trend indicators for multiple time frame analysis.
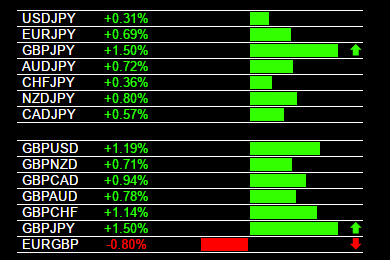
To replace the red and green lights we have The Forex Heatmap®, a fantastic live indicator for guiding your trade entries, that is much more accurate than Wizetrade. We also have various alert systems like audible price alerts that are not available with the Wizetrade system.
So all Wizetrade customers and former customers who are currency traders now have a new, better, and cheaper alternative. The Forexearlywarning trading system works and is highly effective at making pips. We welcome all former Wizetrade clients to our complete trading system. Check us out at Forexearlywarning.com.
The owners of Forexearlywarning.com are all former Wizetrade clients. We built a low cost version of the Wizetrade software and teach multiple time frame analysis in our weekly webinars. We understand what Wizetrade clients are looking for and have built a better currency trading system with these principles.
Former Wizetrade customers who were trading stocks, indexes, and options, here is what we suggest: Consider trading the forex market instead. The forex market is highly liquid, has built-in leverage, and there is no commission on any trades, ever. These are huge advantages over the stock and option market trading. Any trader who was formerly with Wizetrade and whowants to try trading the forex market is always welcome at Forexearlywarning.
The Wizetrade trend analysis system was available to traders for $150 per month. Now that Wizetrade is shutting down their former clients are looking for alternatives to the Wizetrade software and tools.
For currency traders we recommend the Forexearlywarning trading system. The monthly fee of $19.95 for the Forexearlywarning trading system is much cheaper than the Wizetrade system. The documentation for the Forexearlywarning trading system is free on the Forexearlywarning website in the form of 35 written and illustrated forex lessons. To replace the Wizetrade trend analysis software, Forexearlywarning has a set of free trend indicators for multiple time frame analysis.
To replace the red and green lights we have The Forex Heatmap®, a fantastic live indicator for guiding your trade entries, that is much more accurate than Wizetrade. We also have various alert systems like audible price alerts that are not available with the Wizetrade system.
 |
| Wizetrade Replacement - The Forex Heatmap® |
So all Wizetrade customers and former customers who are currency traders now have a new, better, and cheaper alternative. The Forexearlywarning trading system works and is highly effective at making pips. We welcome all former Wizetrade clients to our complete trading system. Check us out at Forexearlywarning.com.
The owners of Forexearlywarning.com are all former Wizetrade clients. We built a low cost version of the Wizetrade software and teach multiple time frame analysis in our weekly webinars. We understand what Wizetrade clients are looking for and have built a better currency trading system with these principles.
Former Wizetrade customers who were trading stocks, indexes, and options, here is what we suggest: Consider trading the forex market instead. The forex market is highly liquid, has built-in leverage, and there is no commission on any trades, ever. These are huge advantages over the stock and option market trading. Any trader who was formerly with Wizetrade and whowants to try trading the forex market is always welcome at Forexearlywarning.